通过 Prometheus 监控 Antrea
目录
- 在 Antrea 中启用 Prometheus Metrics(默认启用)
- 安装 Prometheus 及 Grafana
- 安装 Grafana
- 初始化 Grafana
- Antrea Agent Metric 说明
- Antrea Controller Metric 说明
- Antrea Proxy Metric 说明
- 一些需要关注的指标
在 Antrea 中启用 Prometheus Metrics(默认启用)
默认 Antrea Controller 和 Antrea Agent 会开启 Prometheus 的 Metric 收集,可以通过查看 Antrea Configmap 来确定这个选项是否打开:
` enablePrometheusMetrics: true`
[root@k8s-m01 ~]# kubectl -n kube-system get cm antrea-config -o yaml | grep -C4 Prometheus
    # Note that if it's set to another value, the `containerPort` of the `api` port of the
    # `antrea-agent` container must be set to the same value.
    apiPort: 10350

    # Enable metrics exposure via Prometheus. Initializes Prometheus metrics listener.
    enablePrometheusMetrics: true


    flowExporter:
      # Enable FlowExporter, a feature used to export polled conntrack connections as
--
    # Note that if it's set to another value, the `containerPort` of the `api` port of the
    # `antrea-controller` container must be set to the same value.
    apiPort: 10349

    # Enable metrics exposure via Prometheus. Initializes Prometheus metrics listener.
    enablePrometheusMetrics: true

    # Indicates whether to use auto-generated self-signed TLS certificate.
    # If false, a Secret named "antrea-controller-tls" must be provided with the following keys:
    #   ca.crt: <CA certificate>
安装 Prometheus 及 Grafana
此处直接使用 Antrea 官方提供的部署文件:
# Create a namespace for Prometheus components
apiVersion: v1
kind: Namespace
metadata:
  name: monitoring
  labels:
    name: monitoring
---
apiVersion: v1
kind: ServiceAccount
metadata:
  name: prometheus
  namespace: monitoring
---
# This is useful for testing and manual access to the /metrics endpoints
apiVersion: v1
kind: Secret
metadata:
  name: prometheus-service-account-token
  namespace: monitoring
  annotations:
    kubernetes.io/service-account.name: prometheus
type: kubernetes.io/service-account-token
---
# Authorize Prometheus to view Kubernetes cluster components for service discovery purposes
# Authorize Prometheus to retrieve metrics
apiVersion: rbac.authorization.k8s.io/v1
kind: ClusterRole
metadata:
  name: prometheus
rules:
- apiGroups: [""]
  resources:
  - nodes
  - nodes/proxy
  - services
  - endpoints
  - pods
  verbs: ["get", "list", "watch"]
- apiGroups:
  - networking.k8s.io
  resources:
  - ingresses
  verbs: ["get", "list", "watch"]
- nonResourceURLs: ["/metrics"]
  verbs: ["get"]
---
apiVersion: rbac.authorization.k8s.io/v1
kind: ClusterRoleBinding
metadata:
  name: prometheus
roleRef:
  apiGroup: rbac.authorization.k8s.io
  kind: ClusterRole
  name: prometheus
subjects:
- kind: ServiceAccount
  name: prometheus
  namespace: monitoring
---
# Prometheus Server configuration
apiVersion: v1
kind: ConfigMap
metadata:
  name: prometheus-server-conf
  labels:
    name: prometheus-server-conf
  namespace: monitoring
data:
  prometheus.yml: |-
    global:
      scrape_interval: 5s
      evaluation_interval: 5s

    scrape_configs:
    # Scrape Kubernetes metrics
      - job_name: 'kubernetes-apiservers'
        kubernetes_sd_configs:
        - role: endpoints
        scheme: https
        tls_config:
          ca_file: /var/run/secrets/kubernetes.io/serviceaccount/ca.crt
        bearer_token_file: /var/run/secrets/kubernetes.io/serviceaccount/token
        relabel_configs:
        - source_labels: [__meta_kubernetes_namespace, __meta_kubernetes_service_name, __meta_kubernetes_endpoint_port_name]
          action: keep
          regex: default;kubernetes;https

    # Scrape Antrea Controller metrics
      - job_name: 'antrea-controllers'
        kubernetes_sd_configs:
        - role: endpoints
        scheme: https
        tls_config:
          ca_file: /var/run/secrets/kubernetes.io/serviceaccount/ca.crt
          insecure_skip_verify: true
        bearer_token_file: /var/run/secrets/kubernetes.io/serviceaccount/token
        relabel_configs:
        - source_labels: [__meta_kubernetes_namespace, __meta_kubernetes_pod_container_name]
          action: keep
          regex: kube-system;antrea-controller
        - source_labels: [__meta_kubernetes_pod_node_name, __meta_kubernetes_pod_name]
          target_label: instance

    # Scrape Antrea Agents metrics
      - job_name: 'antrea-agents'
        kubernetes_sd_configs:
        - role: pod
        scheme: https
        tls_config:
          ca_file: /var/run/secrets/kubernetes.io/serviceaccount/ca.crt
          insecure_skip_verify: true
        bearer_token_file: /var/run/secrets/kubernetes.io/serviceaccount/token
        relabel_configs:
        - source_labels: [__meta_kubernetes_namespace, __meta_kubernetes_pod_container_name]
          action: keep
          regex: kube-system;antrea-agent
        - source_labels: [__meta_kubernetes_pod_node_name, __meta_kubernetes_pod_name]
          target_label: instance
---
# Prometheus Server deployment
apiVersion: apps/v1
kind: Deployment
metadata:
  name: prometheus-deployment
  namespace: monitoring
spec:
  selector:
    matchLabels:
      app: prometheus-server
  replicas: 1
  template:
    metadata:
      labels:
        app: prometheus-server
    spec:
      containers:
        - name: prometheus
          image: projects.registry.vmware.com/antrea/prom-prometheus:v2.19.3
          args:
            - "--config.file=/etc/prometheus/prometheus.yml"
            - "--storage.tsdb.path=/prometheus/"
            - "--log.level=debug"
          ports:
            - containerPort: 9090
          volumeMounts:
            - name: prometheus-config-volume
              mountPath: /etc/prometheus/
            - name: prometheus-storage-volume
              mountPath: /prometheus/
      serviceAccountName: prometheus
      volumes:
        - name: prometheus-config-volume
          configMap:
            defaultMode: 420
            name: prometheus-server-conf
        - name: prometheus-storage-volume
          emptyDir: {}
---
apiVersion: v1
kind: Service
metadata:
  name: prometheus-service
  namespace: monitoring
  annotations:
      prometheus.io/scrape: 'true'
      prometheus.io/port:   '9090'
spec:
  selector:
    app: prometheus-server
  type: NodePort
  ports:
    - port: 8080
      targetPort: 9090
      nodePort: 30000
在 Kubernetes 集群中应用上面的 YAML 文件:
[root@k8s-m01 ~]# kubectl apply -f antrea-prometheus.yml
namespace/monitoring created
serviceaccount/prometheus created
secret/prometheus-service-account-token created
clusterrole.rbac.authorization.k8s.io/prometheus created
clusterrolebinding.rbac.authorization.k8s.io/prometheus created
configmap/prometheus-server-conf created
deployment.apps/prometheus-deployment created
service/prometheus-service created
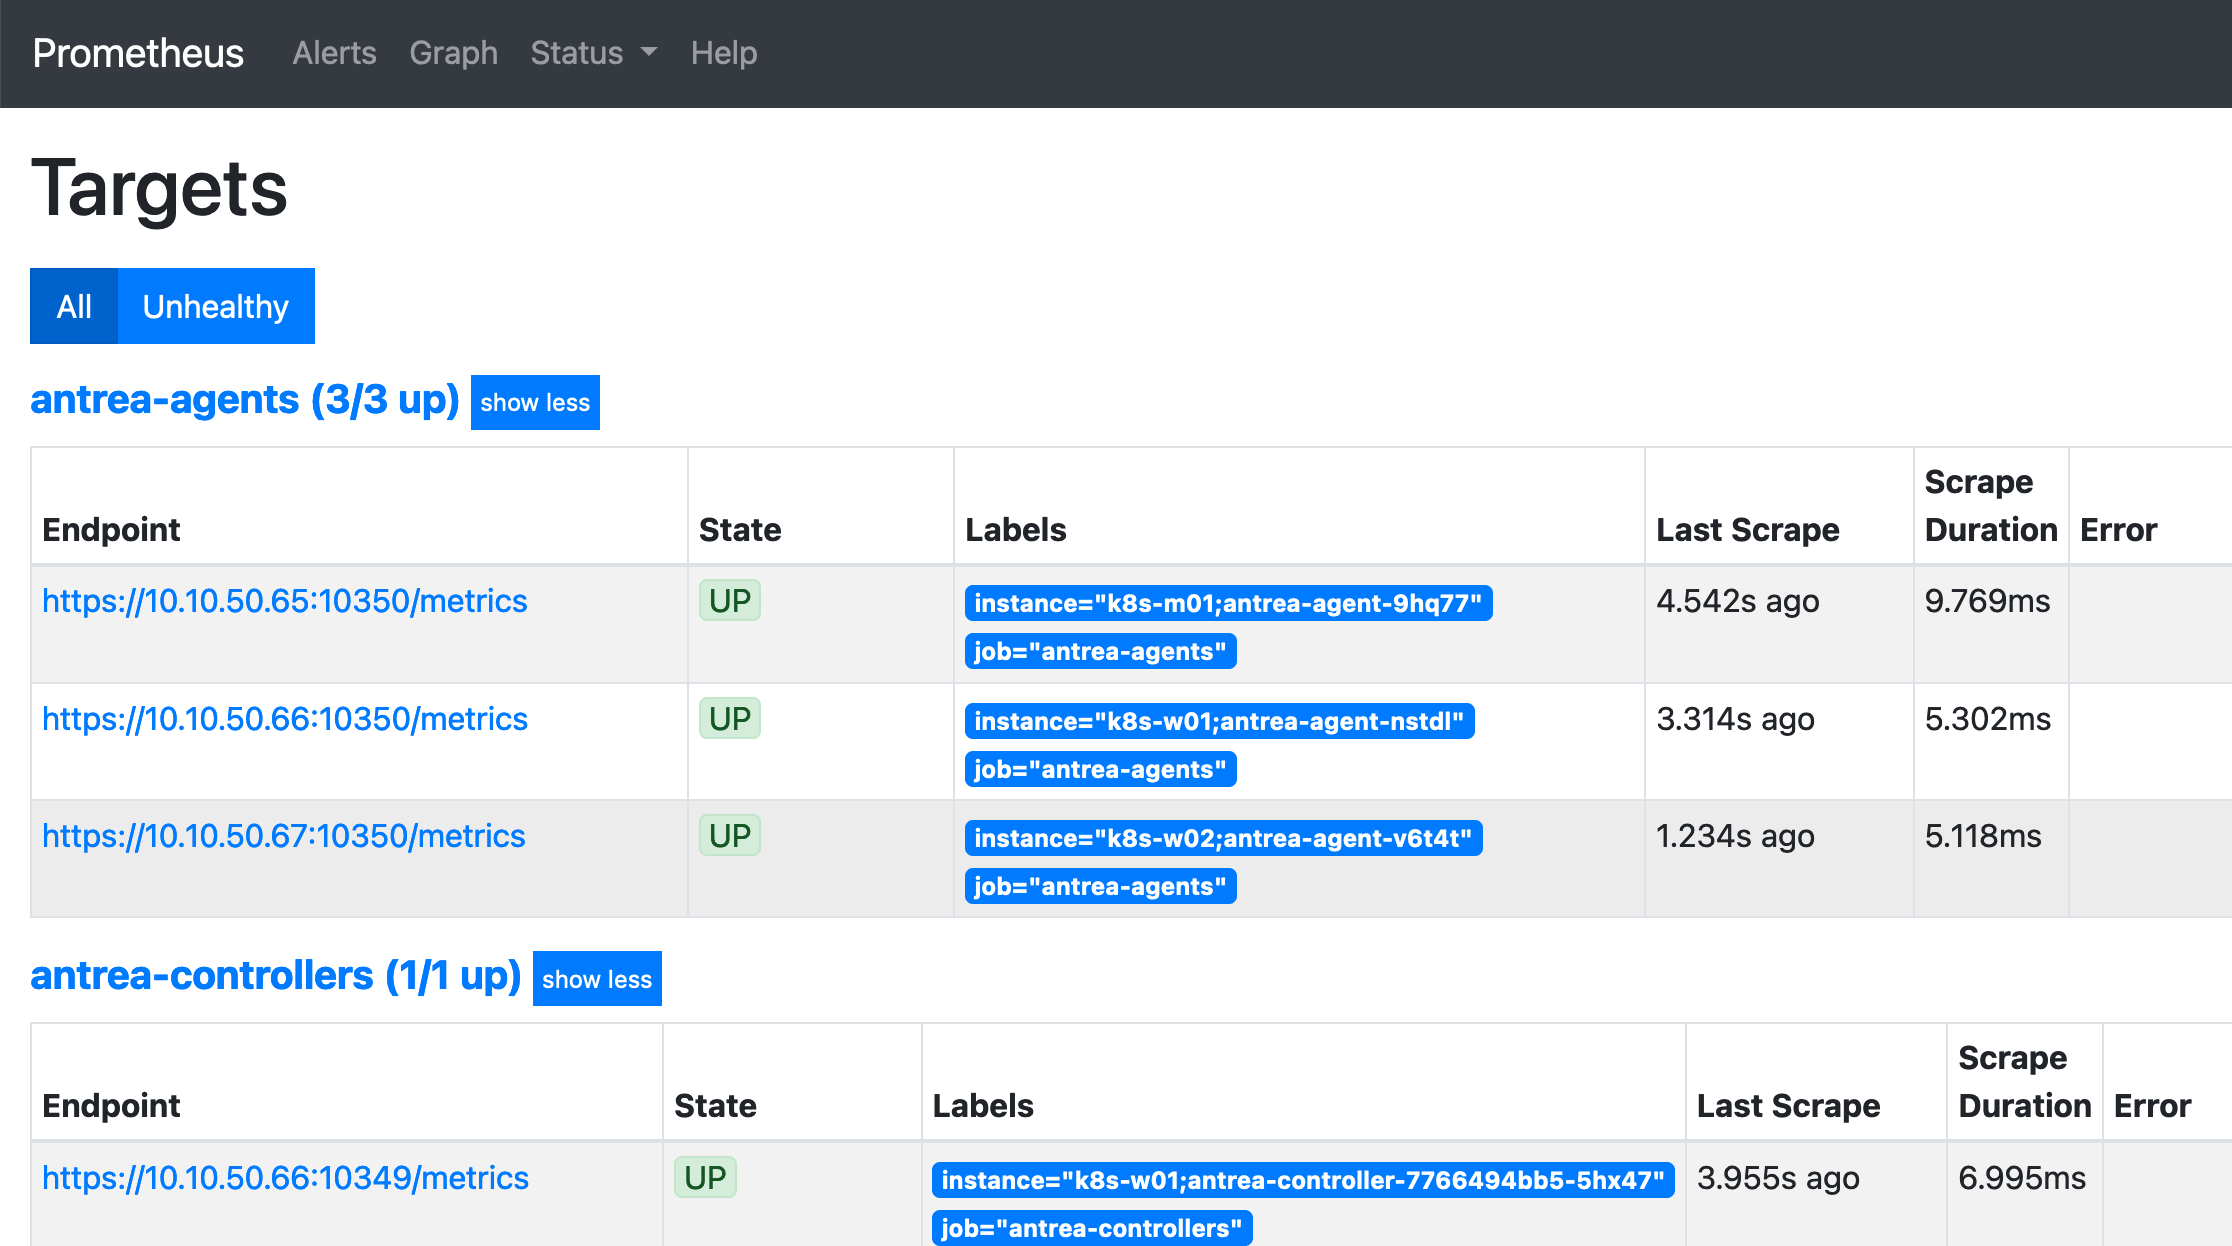
启动 Prometheus 后,在 Target 中查看 metric 收集状态:
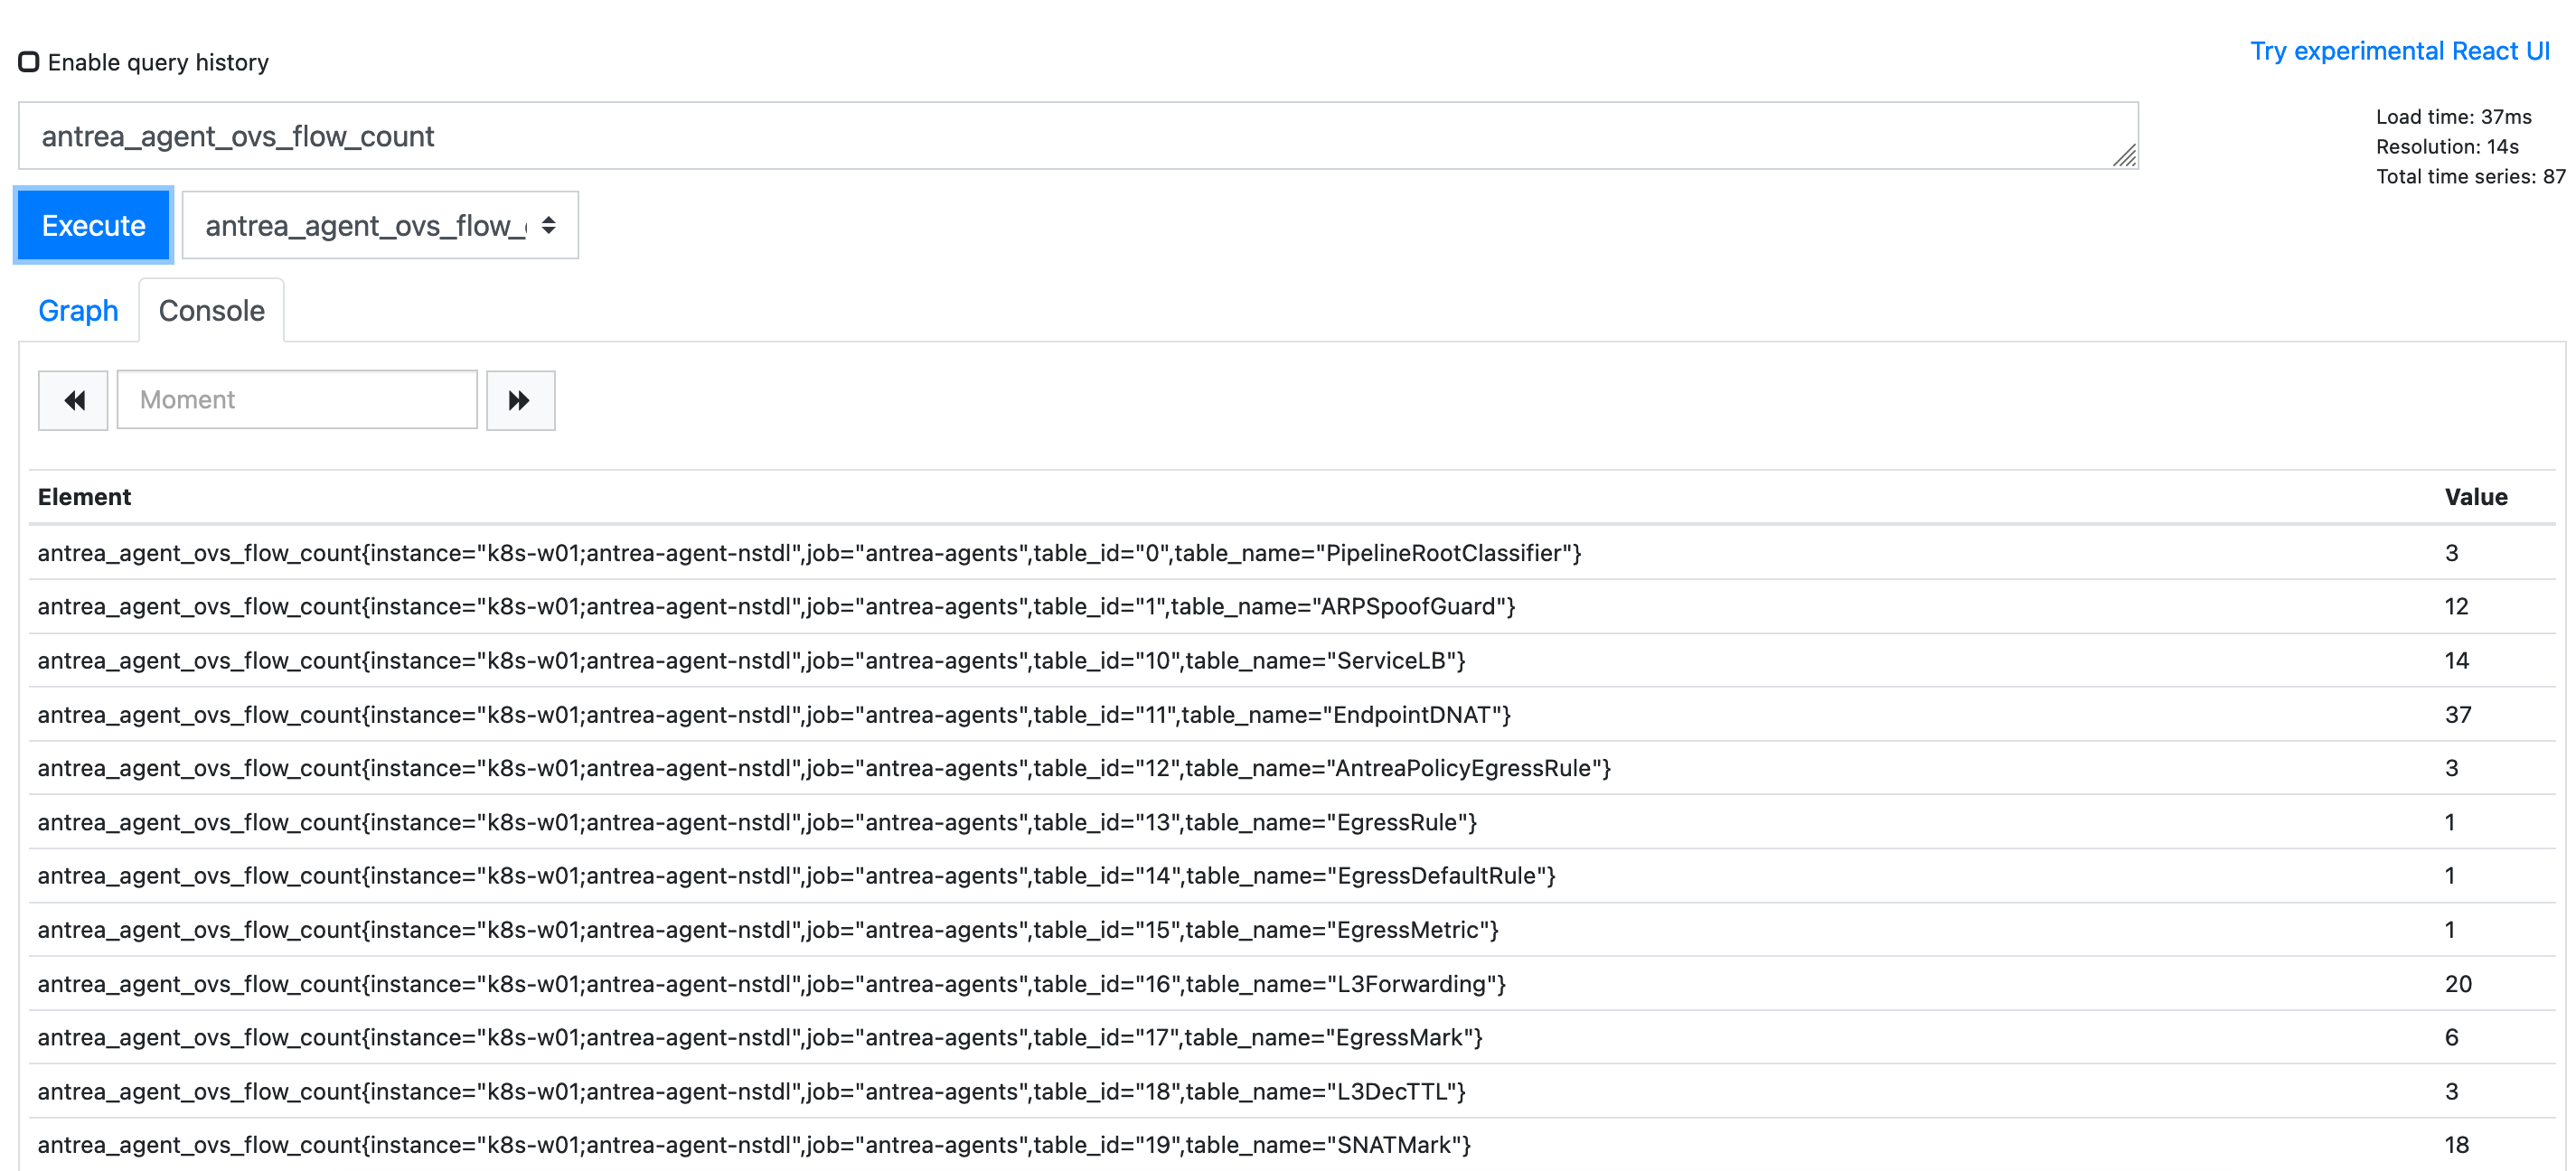
在 Prometheus 中执行查询,可以正确查到结果:
安装 Grafana
通过 Docker 运行 Grafana:
mkdir /root/grafana
chown 65534:65534 /root/grafana
chmod 777 /root/grafana
docker run -d --restart always -p 80:3000 --name=grafana --volume "/root/grafana:/var/lib/grafana" grafana/grafana-enterprise
初始化 Grafana
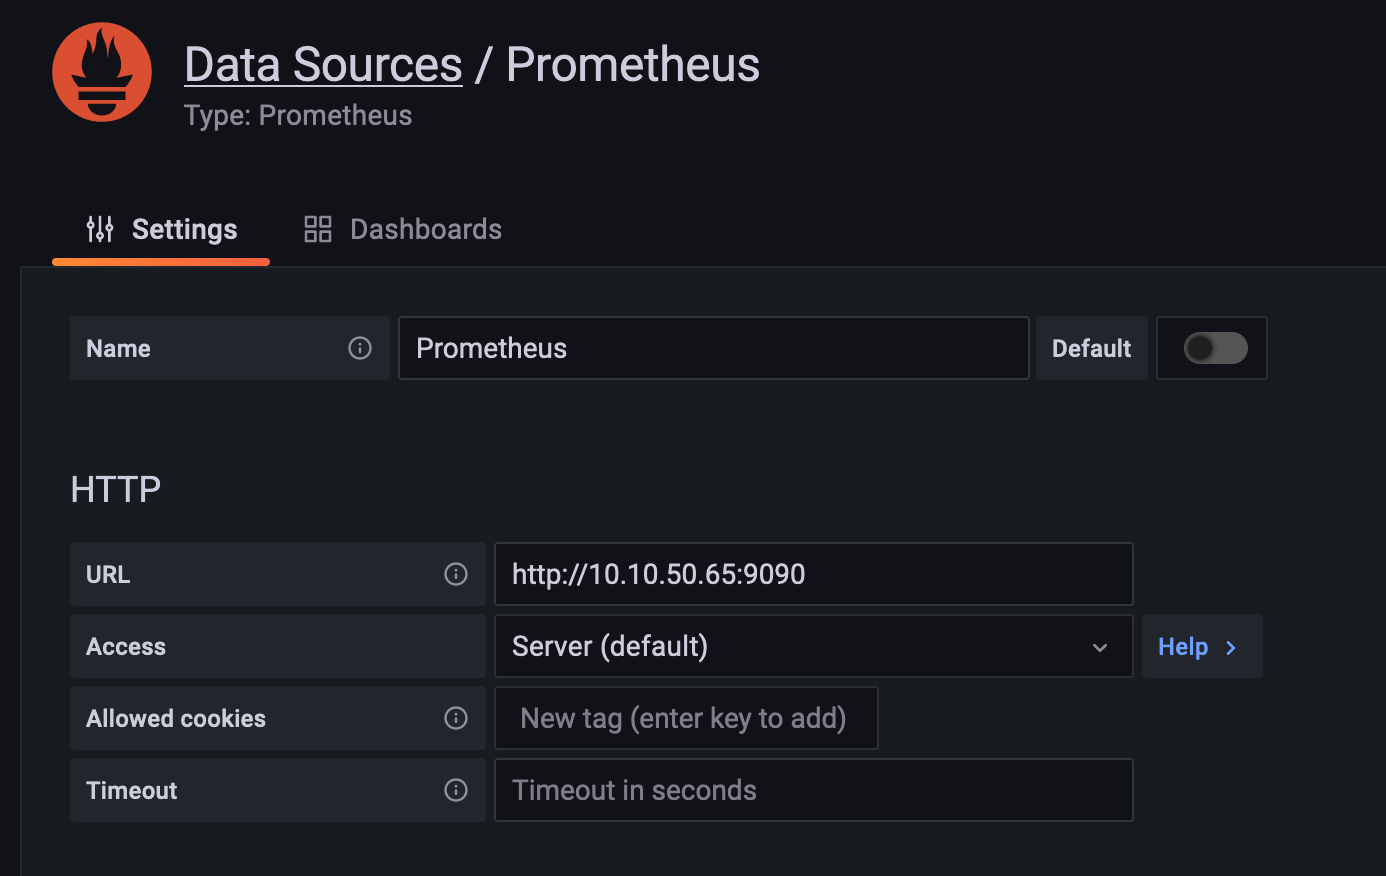
在 Grafana 中添加 Prometheus Datasource,名称保持默认不变,将其设为 Default:
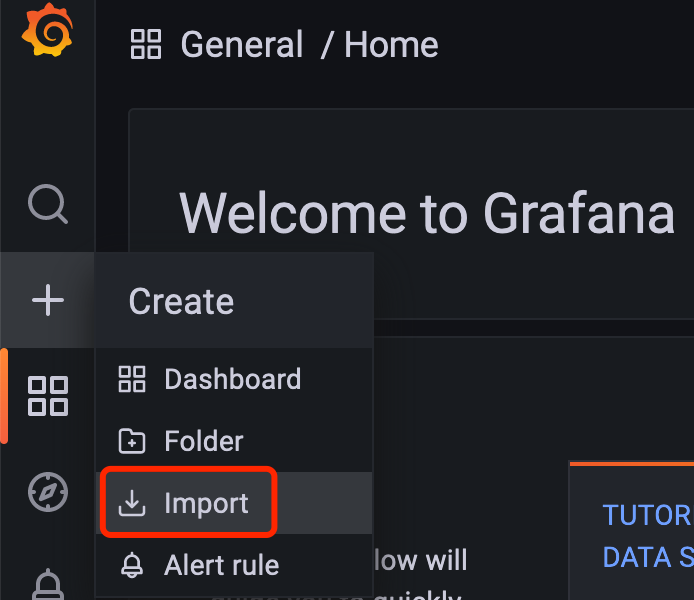
导入 Dashborad
在这里下载 Prometheus 的 Grafana Dashborad(这是个简单的版本,还需要再细化)。
导入 Grafana 中:
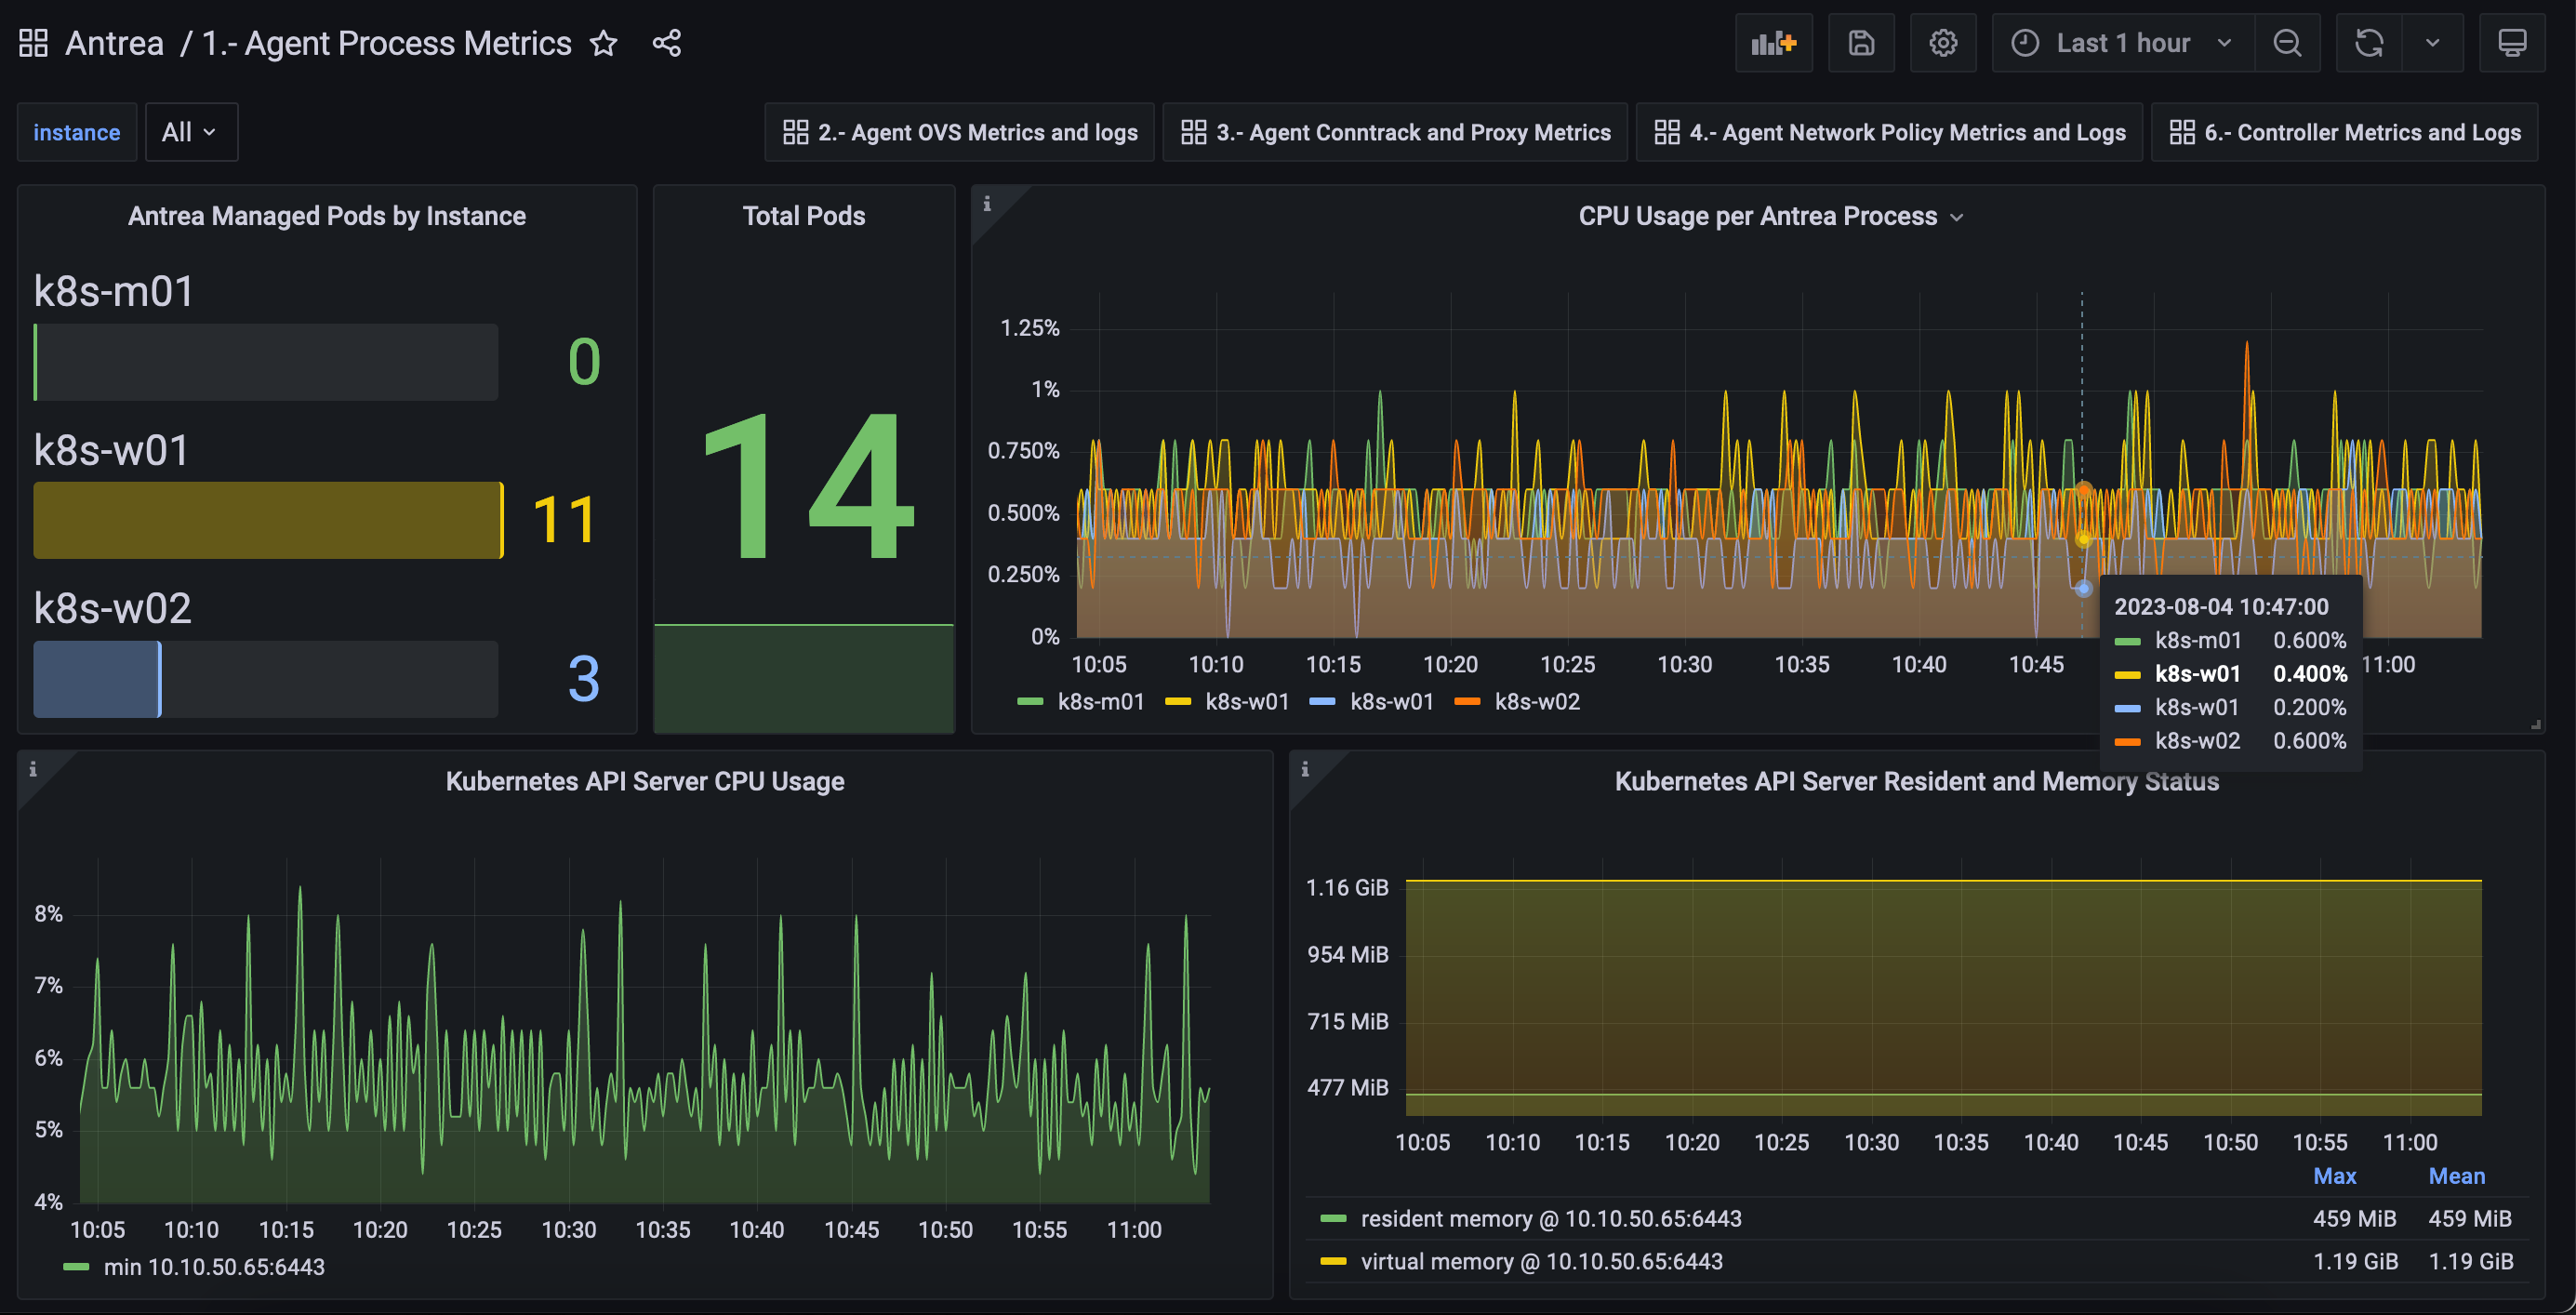
可以看到正确收到了信息:
Antrea Agent Metric 说明
- antrea_agent_conntrack_antrea_connection_count: Number of connections in the Antrea ZoneID of the conntrack table. This metric gets updated at an interval specified by flowPollInterval, a configuration parameter for the Agent.
- 此参数代表每个 Antrea Zone 的 OVS conntrack table 的连接数
- Connection tracking 用于匹配 Flow 的 TCP、UDP 和 ICMP 等状态
- 所有状态包含:new、est、rel、rpl、inv、trk、snat、dnat (https://docs.openvswitch.org/en/latest/tutorials/ovs-conntrack/)
- antrea_agent_conntrack_max_connection_count: Size of the conntrack table. This metric gets updated at an interval specified by flowPollInterval, a configuration parameter for the Agent.
- Connection tracking 表的大小
- antrea_agent_conntrack_total_connection_count: Number of connections in the conntrack table. This metric gets updated at an interval specified by flowPollInterval, a configuration parameter for the Agent.
- OVS conntrack table 的连接数
- antrea_agent_denied_connection_count: Number of denied connections detected by Flow Exporter deny connections tracking. This metric gets updated when a flow is rejected/dropped by network policy.
- 被 Network Policy 丢弃的连接数
- antrea_agent_egress_networkpolicy_rule_count: Number of egress NetworkPolicy rules on local Node which are managed by the Antrea Agent.
- 节点上的 Egress Network Policy 数量
- antrea_agent_flow_collector_reconnection_count: Number of re-connections between Flow Exporter and flow collector. This metric gets updated whenever the connection is re-established between the Flow Exporter and the flow collector (e.g. the Flow Aggregator).
- 重新建立连接的连接数
- antrea_agent_ingress_networkpolicy_rule_count: Number of ingress NetworkPolicy rules on local Node which are managed by the Antrea Agent.
- 节点上的 ingress Network Policy 数量
- antrea_agent_local_pod_count: Number of Pods on local Node which are managed by the Antrea Agent.
- 每个节点上的 Pod 数量
- antrea_agent_networkpolicy_count: Number of NetworkPolicies on local Node which are managed by the Antrea Agent.
- 每个节点上的 Network Policy 数量
- antrea_agent_ovs_flow_count: Flow count for each OVS flow table. The TableID is used as a label.
- 每个节点上不同 Table 下 OVS 流数量
- antrea_agent_ovs_flow_ops_count: Number of OVS flow operations, partitioned by operation type (add, modify and delete).
- 不同 OVS 操作事件的数量,包含 add、delete、modify 三种
- antrea_agent_ovs_flow_ops_error_count: Number of OVS flow operation errors, partitioned by operation type (add, modify and delete).
- OVS 操作事件的错误计数
- antrea_agent_ovs_flow_ops_latency_milliseconds_sum: The latency of OVS flow operations, partitioned by operation type (add, modify and delete).
- OVS 操作耗费的时间
- antrea_agent_ovs_total_flow_count: Total flow count of all OVS flow tables.
- 所有 table 的 OVS 流数量数
Antrea Controller Metric 说明
- antrea_controller_acnp_status_updates: The total number of actual status updates performed for Antrea ClusterNetworkPolicy Custom Resources
- ACNP 更新次数
- antrea_controller_address_group_processed: The total number of address-group processed
- 被 Antrea Controller 处理过(发现)的地址组数
- antrea_controller_address_group_sync_duration_milliseconds: The duration of syncing address-group
- 地址组同步耗时
- antrea_controller_anp_status_updates: The total number of actual status updates performed for Antrea NetworkPolicy Custom Resources
- ANP 更新次数
- antrea_controller_applied_to_group_processed: The total number of applied-to-group processed
- 应用到组的次数
- antrea_controller_applied_to_group_sync_duration_milliseconds: The duration of syncing applied-to-group
- 应用到组的处理时间
- antrea_controller_length_address_group_queue: The length of AddressGroupQueue
- antrea_controller_length_applied_to_group_queue: The length of AppliedToGroupQueue
- antrea_controller_length_network_policy_queue: The length of InternalNetworkPolicyQueue
- antrea_controller_network_policy_processed: The total number of internal-networkpolicy processed
- 所有被处理的 Network Policy 数目
- antrea_controller_network_policy_sync_duration_milliseconds: The duration of syncing internal-networkpolicy
- Network Policy 同步操作耗费的时间
Antrea Proxy Metric 说明
- antrea_proxy_sync_proxy_rules_duration_seconds: SyncProxyRules duration of AntreaProxy in seconds
- Proxy 相关规则同步时间
- antrea_proxy_total_endpoints_installed: The number of Endpoints installed by AntreaProxy
- 每个 Antrea Proxy 处理的 Endpoint 数量(即 kubectl get ep -A 的数量总和)
- antrea_proxy_total_endpoints_updates: The cumulative number of Endpoint updates received by AntreaProxy
- Endpoints 更新次数计数
- antrea_proxy_total_services_installed: The number of Services installed by AntreaProxy
- 每个 Antrea Proxy 处理的 Service 数量
- antrea_proxy_total_services_updates: The cumulative number of Service updates received by AntreaProxy
- Service 更新次数计数
一些需要关注的指标
上面列举了很多 Antrea 支持的参数,但个人认为实际应用中需要关注操作时间、操作错误以及各种上限。
| 指标 | 说明(下面最大值需要根据规模调整) |
|---|---|
| antrea_controller_network_policy_sync_duration_milliseconds | 网络策略同步耗时(应小于 1s) |
| antrea_controller_applied_to_group_sync_duration_milliseconds | 组同步耗时(应小于 1s) |
| antrea_controller_address_group_sync_duration_milliseconds | 地址组同步耗时(应小于 1s) |
| antrea_proxy_sync_proxy_rules_duration_seconds | Proxy 相关规则同步时间(应小于 1s) |
| antrea_agent_ovs_flow_ops_latency_milliseconds_sum | OVS 流表操作时间(应小于 1s) |
| antrea_agent_ovs_flow_ops_error_count | OVS 操作失败计数 |
| antrea_agent_ovs_total_flow_count | OVS 流表数变化 |
| process_cpu_seconds_total{job=~”antrea.*”} | Antrea Controller/Agent CPU 使用率 |
| process_resident_memory_bytes{job=~”antrea.*”} | Antrea Controller/Agent 常驻内存使用量 |
| process_virtual_memory_bytes{job=~”antrea.*”} | Antrea Controller/Agent 虚拟内存使用量 |
| process_open_fds{job=~”antrea.*”} | 应远小于 process_max_fds |
| antrea_agent_local_pod_count{instance=~”^$instance.*”} | 应小于240(默认每个 Node 为 /24 的子网) |
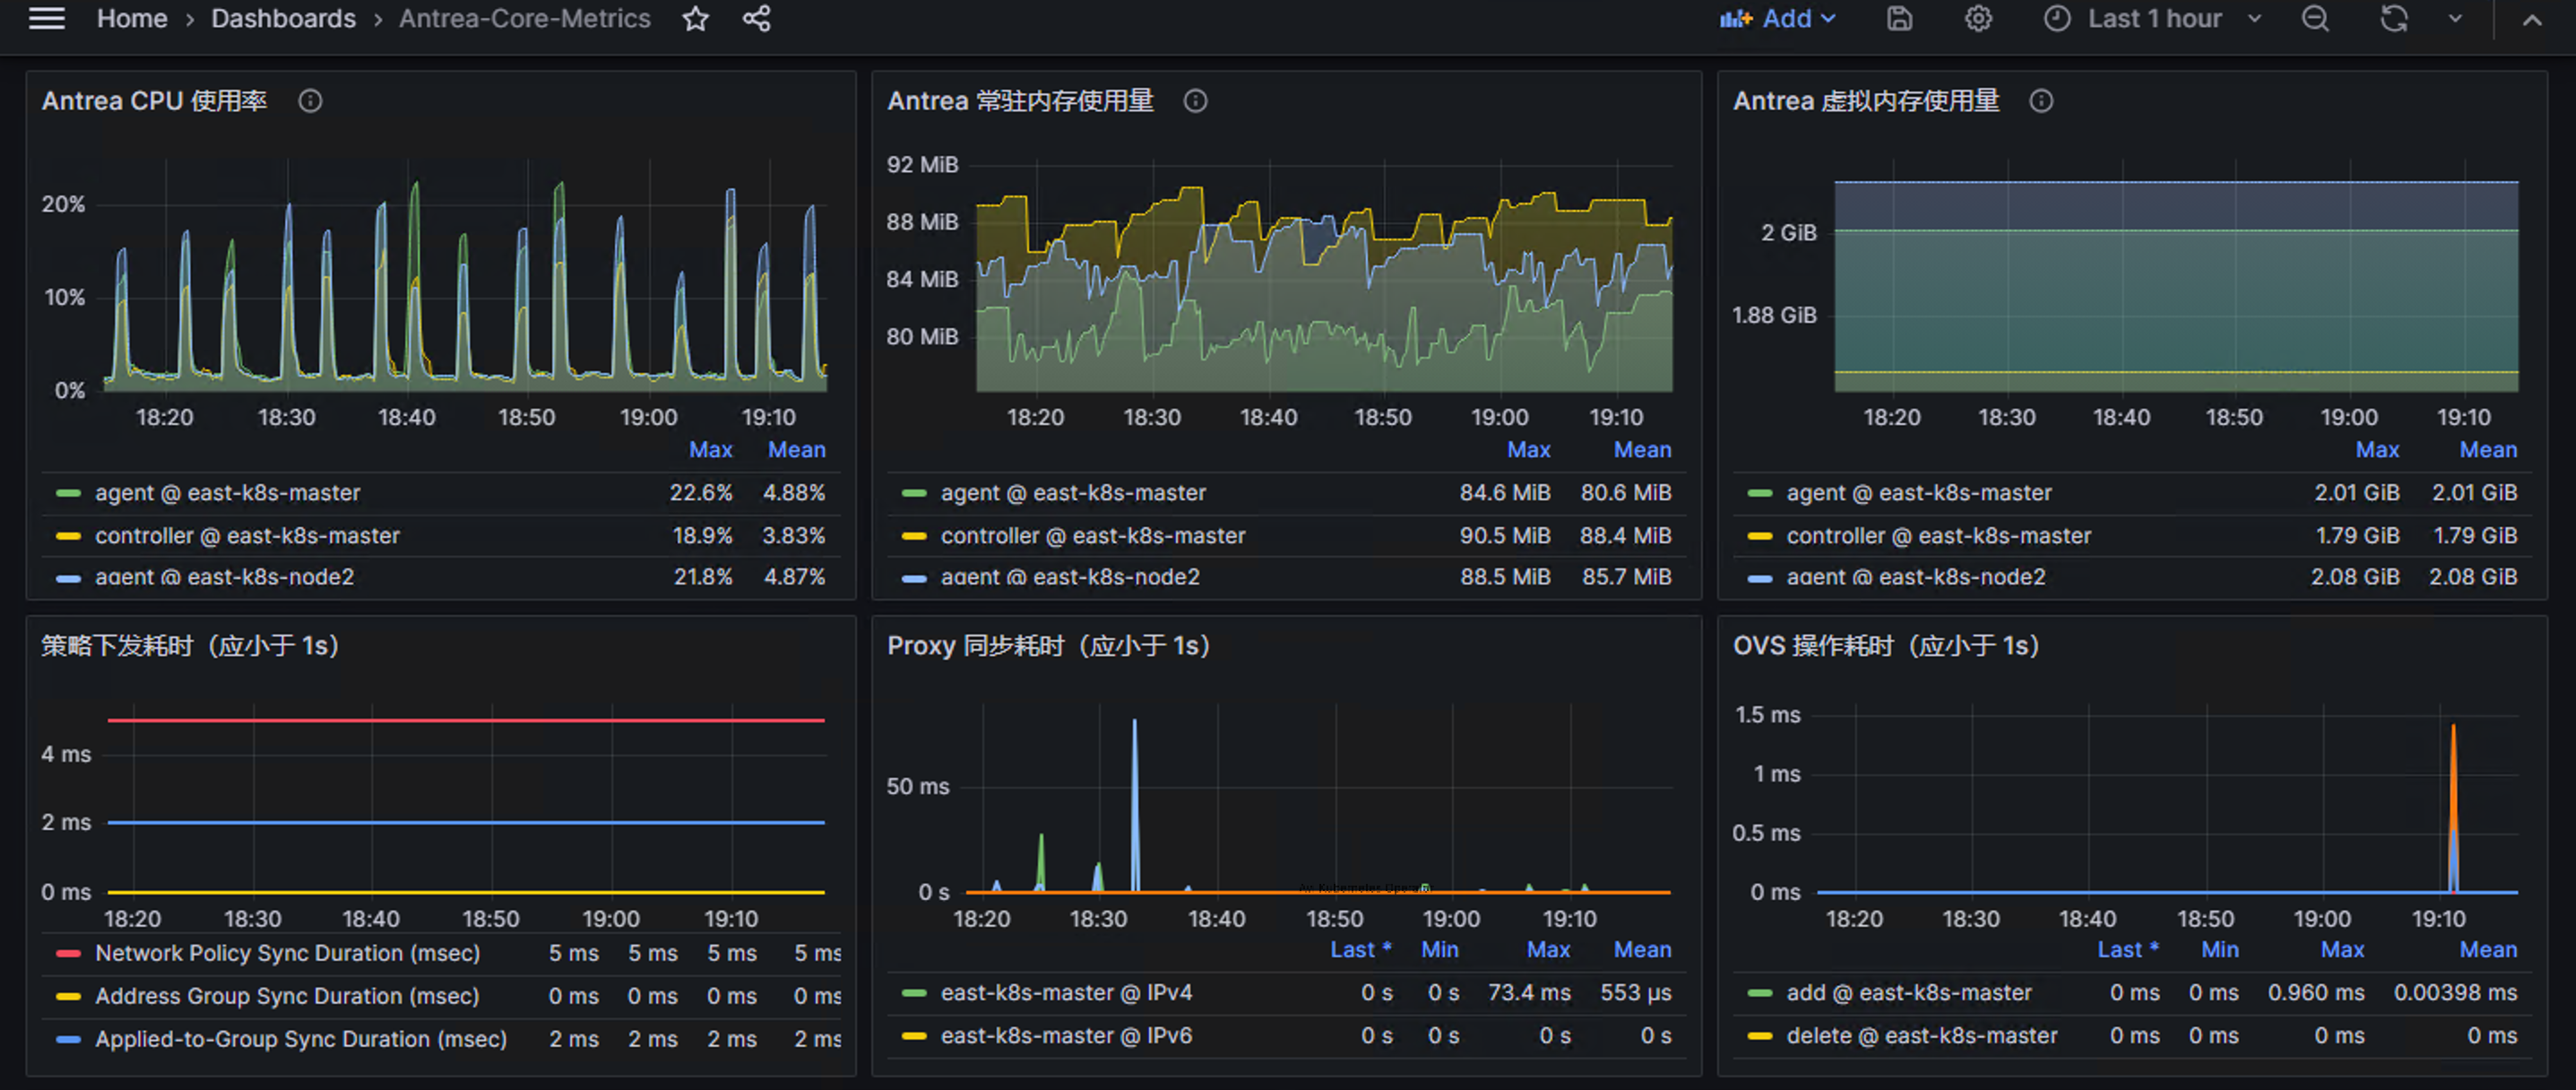
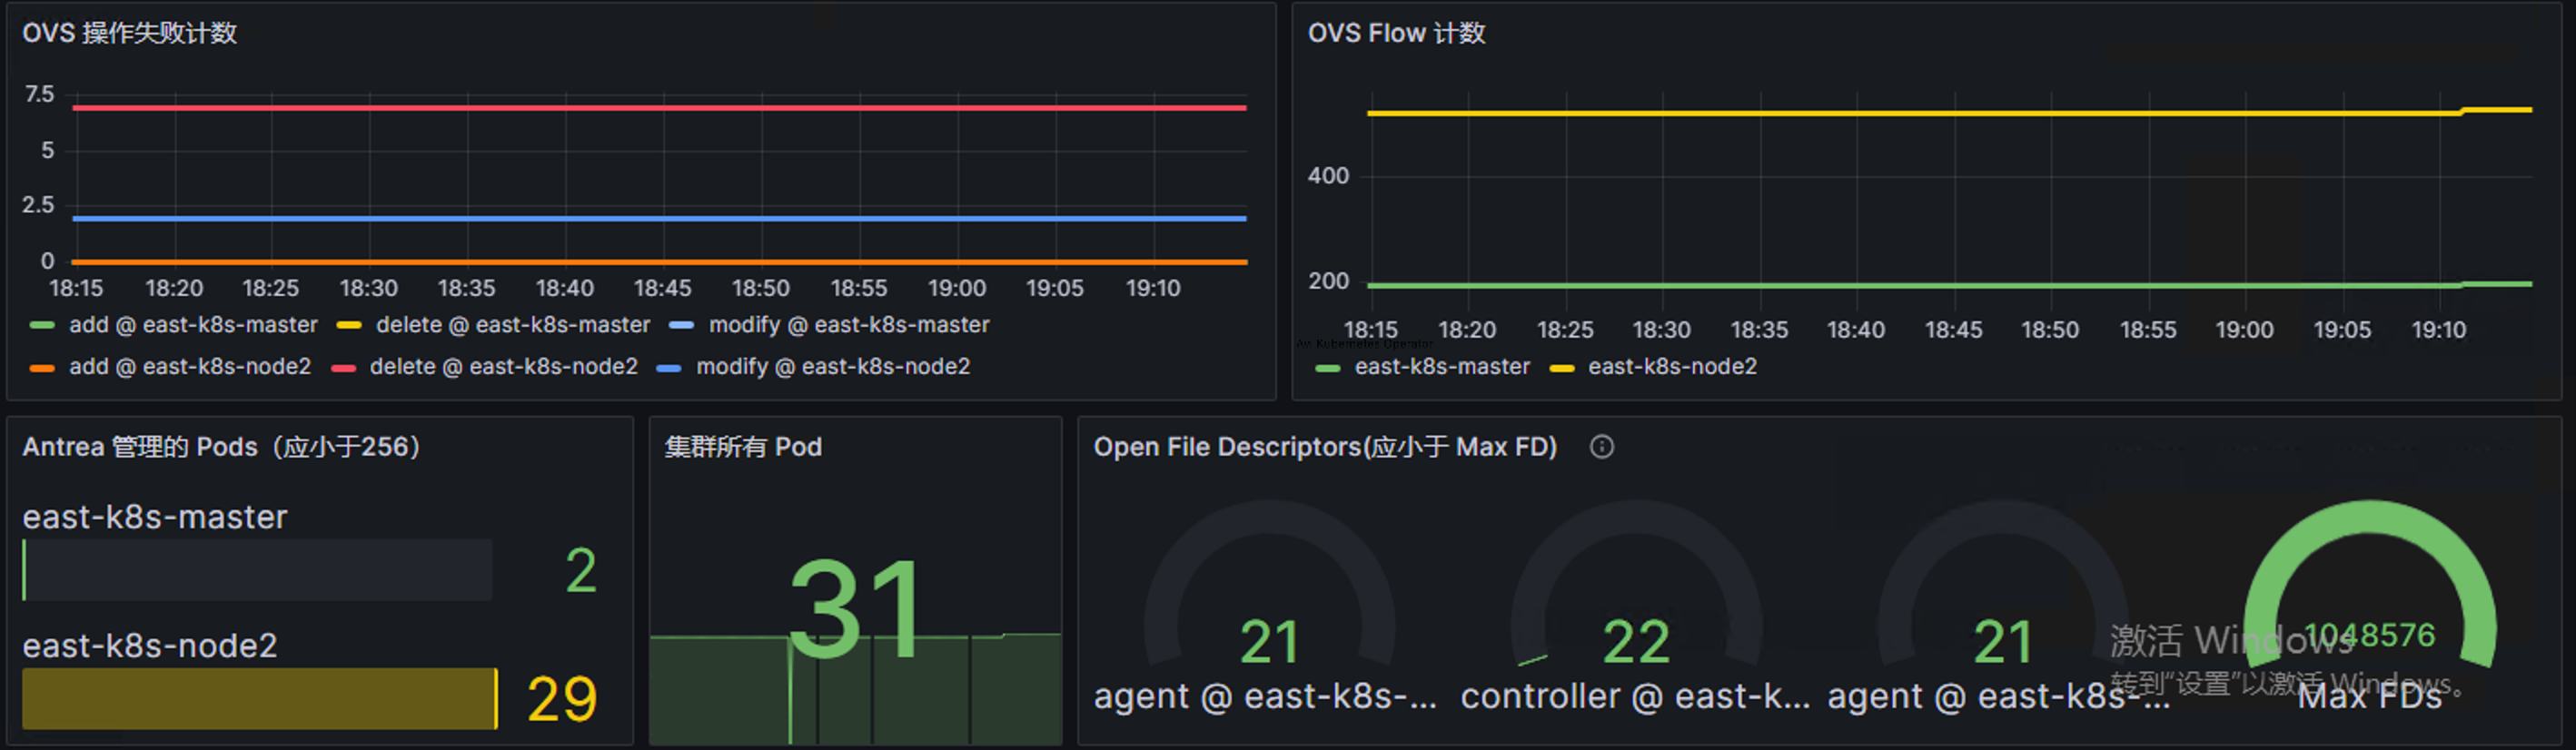
下面是关键指标的 Dashborad,此处可以下载,供参考: